
Plot candle sticks with OHLC data from url - Python code
How to Plot candle sticks with OHLC data from url complete Python code
Data Preparation:
ohlc_data is now a list of tuples containing (timestamp, open, high, low, close, volume).
This list is converted into a pandas DataFrame df with columns 'Date', 'Open', 'High', 'Low', 'Close', 'Volume'.
The 'Date' column is converted to datetime format and set as the index of the DataFrame df.
mplfinance Usage:
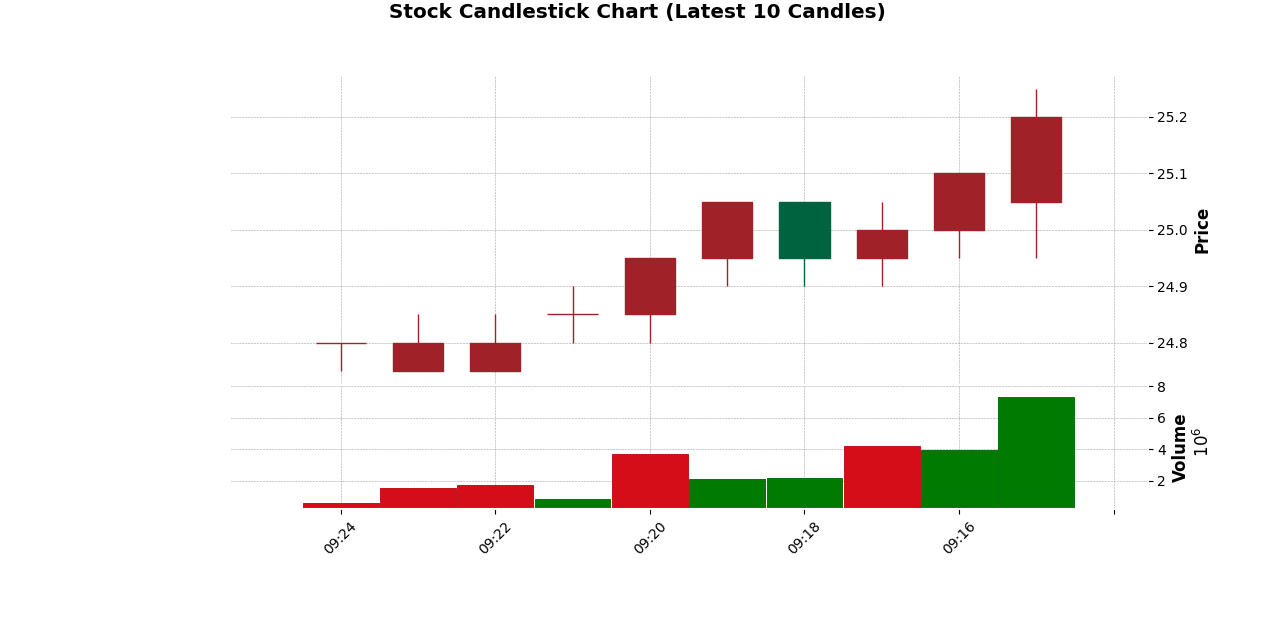
The DataFrame df is now passed directly to mpf.plot() for plotting the candlestick chart.
type='candle', style='charles', volume=True are used as before to specify the chart type, style, and inclusion of volume bars.
This should now correctly plot the latest 10 candles from the provided URL as a stock candlestick chart using mplfinance, ensuring that the data format is compatible with the library's requirements. Adjustments can be made to chart styling and other parameters based on your specific visualization needs.
import requestsimport pandas as pdimport mplfinance as mpffrom datetime import datetime# URL for fetching historical 1-minute dataurl = 'https://api-v2.upstox.com/historical-candle/NSE_EQ|INE528G01035/1minute/2024-05-18'try: # Fetch data from the URL response = requests.get(url) # Check if the request was successful (status code 200) if response.status_code == 200: # Parse JSON response data = response.json() # Check if 'data' key exists and extract the candles data if 'data' in data and 'candles' in data['data']: candles_data = data['data']['candles'] # Limit to latest 10 candles candles_data = candles_data[-10:] # Prepare data for candlestick chart ohlc_data = [] for candle in candles_data: timestamp_str = candle[0] # Example: '2024-05-18T12:29:00+05:30' timestamp = datetime.fromisoformat(timestamp_str[:-6]) # Remove timezone info for compatibility ohlc_data.append((timestamp, candle[1], candle[2], candle[3], candle[4], candle[5])) # Create a DataFrame from the prepared OHLC data df = pd.DataFrame(ohlc_data, columns=['Date', 'Open', 'High', 'Low', 'Close', 'Volume']) # Convert 'Date' column to datetime format df['Date'] = pd.to_datetime(df['Date']) # Set 'Date' column as index df.set_index('Date', inplace=True) # Plot candlestick chart mpf.plot(df, type='candle', style='charles', volume=True, title='Stock Candlestick Chart (Latest 10 Candles)', ylabel='Price', ylabel_lower='Volume', figratio=(16, 10), figsize=(14, 8)) else: print("No valid candles data found in the response.") else: print(f"Failed to fetch data: {response.status_code}") except requests.exceptions.RequestException as e: print(f"Request error: {e}")except KeyError as e: print(f"KeyError: {e}. Check data structure in response.")except Exception as e: print(f"Error: {e}")
No Comments have been Posted.